ASSET
Asset
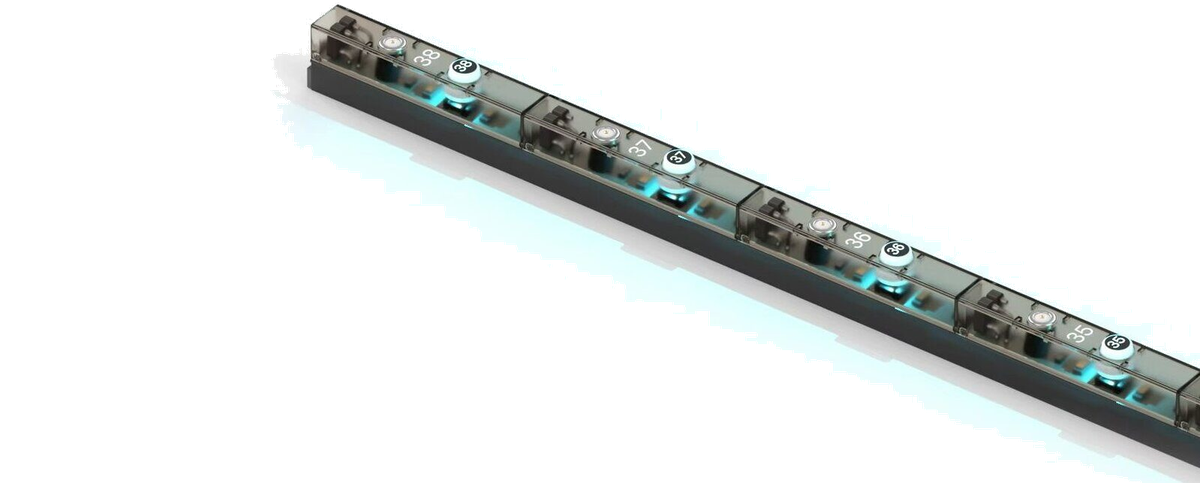
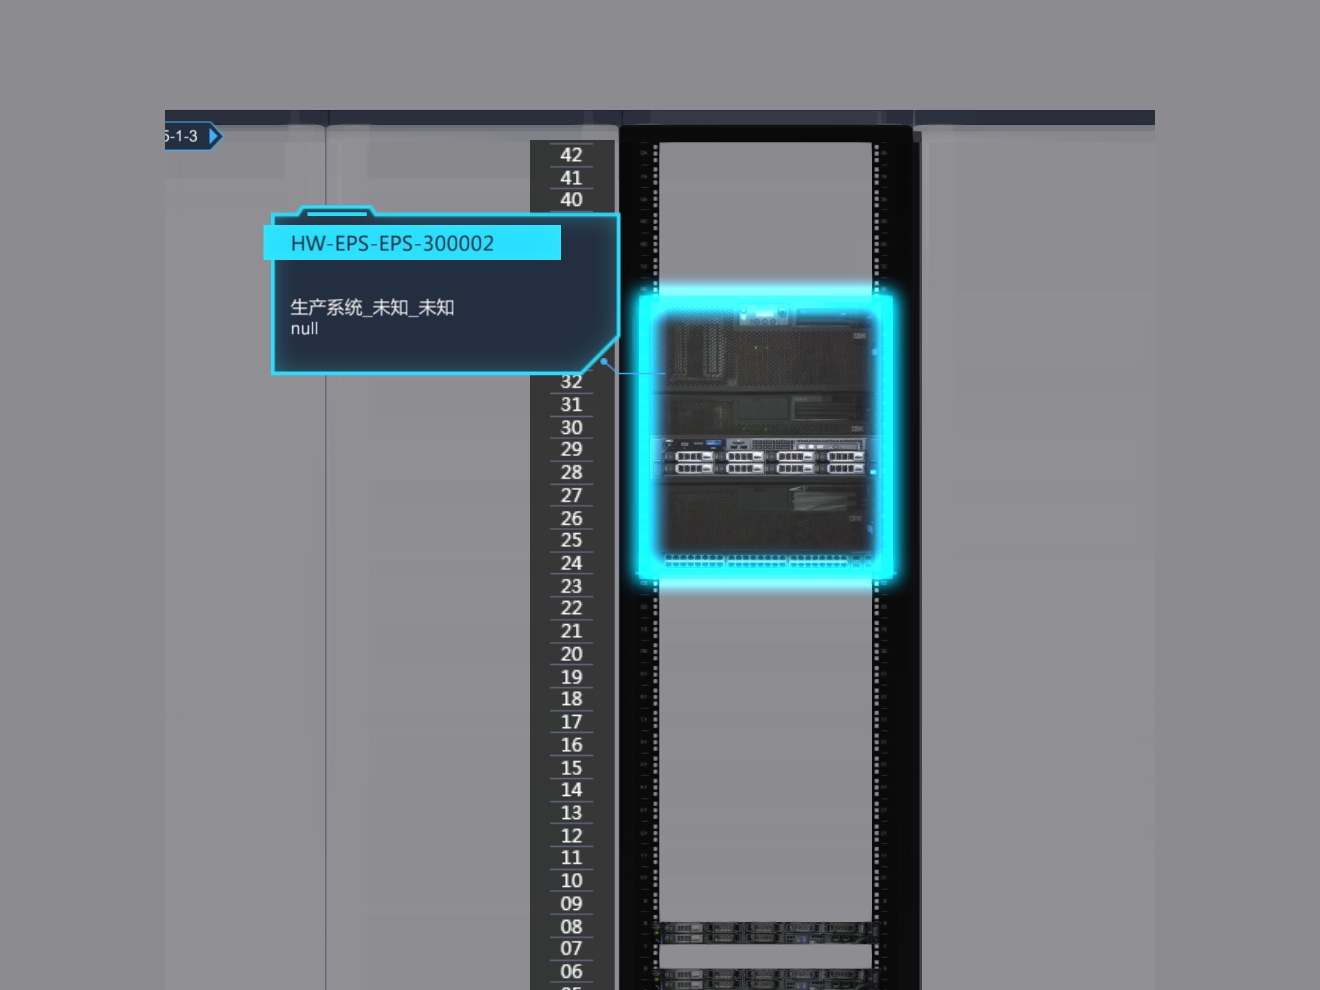
Automatic capture of the identity and occupied U position of installed equipment forms a continuously auditable asset register and a real-time record of each asset's physical location.
The data centre operations framework groups infrastructure resources into asset, U-space, rated power and cooling capacity. Of the four, U-space and cooling capacity depend most on on-site data — and are most often missing.
ASSET
Automatic capture of the identity and occupied U position of installed equipment forms a continuously auditable asset register and a real-time record of each asset's physical location.
U-SPACE
U occupancy visible in real time: free U positions, available mounting positions and fragmented space; installation approval no longer depends on a site survey.
RATED POWER
Combining rated power with real-time consumption to determine rack power density (kW/rack) and distribution headroom, and to identify high-density racks.
COOLING CAPACITY
In-rack temperature distribution and ΔT (intake-to-exhaust) to judge cooling delivery effectiveness and locate hot and cold spots.
The value of an asset register depends on how well it matches reality. Manual inventory gives a point-in-time snapshot; rack-level sensing gives continuous, auditable real-time state.
Capacity planning is often conservative for lack of on-site data — sizing installed capacity from nameplate power leaves cooling over-provisioned overall yet locally too hot. Rack-level sensing makes all three kinds of headroom measurable and predictable.
U-SPACE
U headroom and deployable equipment density counted by rack and by room.
RATED POWER
Rack power density (kW/rack) and distribution headroom, identifying the high-density racks that need attention (e.g. >5 kW).
COOLING CAPACITY
Intake temperature and ΔT headroom, used to assess how much additional load can still be supported without breaching thermal limits.
Industry research indicates that around 10% of racks run above recommended temperatures; the root cause is often bypass airflow and recirculation, with unblanked unused U positions among the most common triggers. Locating the problem requires in-rack, U-level temperature data.
Field experience shows that targeted airflow adjustment based on rack-level temperature data improves cooling delivery effectiveness by 20%.
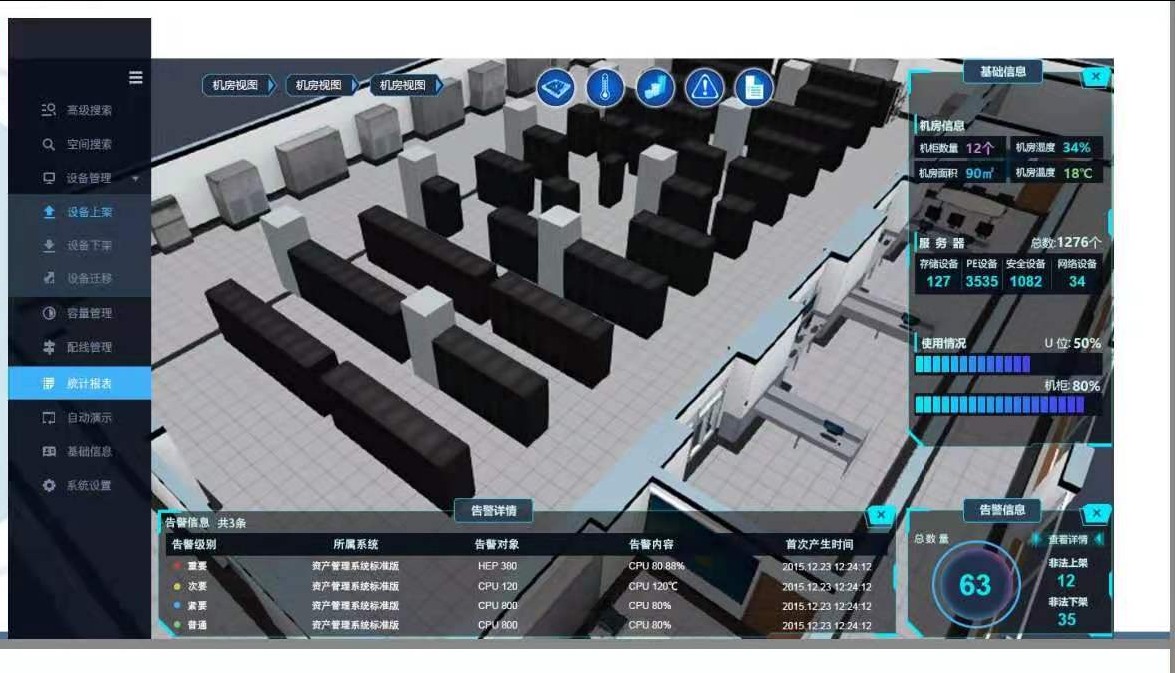
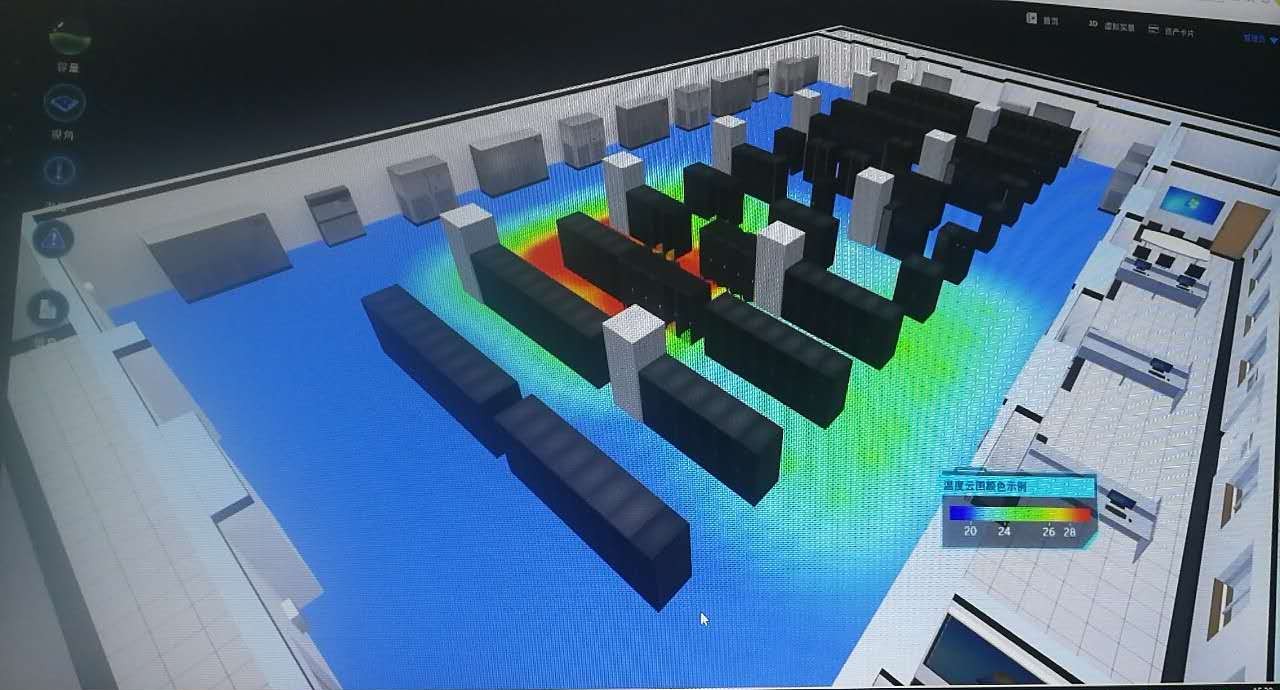
A single temperature reading is just a number; correlation is what turns it into a judgement. The system aligns multi-dimensional data on one timeline.
| Data dimension | Source | Judgement after correlation |
|---|---|---|
| Where the temperature changed | U-position temperature sensing in the bar | Which U position the difference appears at |
| Asset state at that U position | Rack U Asset Monitor Bar | Whether a device is present, and whether it is an unblanked empty position |
| Rated power / real-time consumption | Asset register + current transformers | How much heat it should produce, and whether measured draw matches |
| ΔT | Paired intake-exhaust temperature measurement | Whether cooling is effective, and whether it is bypassed or recirculated |
| Observed | Likely root cause | Suggested action |
|---|---|---|
| Intake temperature at a U position is high | Insufficient cooling allocation / the position sits in a dead zone | Review floor delivery and containment; rebalance cooling |
| ΔT rises abnormally | Recirculation / bypass airflow | Check blanking panels, rack cut-outs and cable-tray openings |
| Temperature difference concentrated in upper U positions | Hot air accumulating at the top | Improve blanking and top sealing; review the installation layout |
| High power density rack runs persistently hot | Load density exceeds the cooling design for that zone | Evaluate capacity expansion or cold-plate / liquid cooling retrofit |
The rack-level sensing layer outputs data upwards through standard interfaces, integrating with existing DCIM, environmental monitoring, ITSM and automation platforms to avoid duplicated build-out.
Across finance, carriers, internet and cloud, energy and transport, and government; deployed in data centres in the United States, Japan, Korea, Singapore, Australia, Germany and Hong Kong; average return on investment 9 months.

Our on-board weighing and structural load sensing product line is served by our US brand Weigh2X TECH, on its own dedicated site.
The current generation product is the GX-6 Axle Load Sensing Unit.